

What if the numbers on your ClickBank dashboard weren’t just a confusing collection of digits, but a clear GPS leading directly to your next $10,000 month? It’s incredibly frustrating to watch your traffic numbers climb while your sales remain stagnant, especially when you can’t pin down exactly where the disconnect is happening. If you’ve ever felt like your campaign data is a “black box” that refuses to reveal its secrets, you’re certainly not alone. Many affiliates struggle to distinguish between ‘Raw Hops’ and ‘Unique Hops,’ which often leads to expensive mistakes and missed opportunities for growth.
Mastering the art of understanding ClickBank reporting and analytics is the bridge between a struggling side hustle and a truly scalable business. This guide will help you interpret every metric with the clarity of a seasoned pro, ensuring you never have to guess about your profitability again. You’ll learn how to identify funnel leaks instantly, calculate your true ROI, and gain the confidence to scale your ad spend based on real-time data. We’re moving past the surface-level numbers to explore the mechanics of how your traffic actually converts, providing you with a structured roadmap for sustainable affiliate success in 2026.
Key Takeaways
- Learn to distinguish between ‘Unique Hops’ and ‘Raw Hops’ to accurately measure the volume of interested visitors engaging with your offers.
- By mastering the art of understanding ClickBank reporting and analytics, you can pinpoint exactly where potential customers are dropping off in your sales funnel.
- Use ‘Order Form Impressions’ as a diagnostic tool to evaluate the strength of your bridge page and the effectiveness of your call to action.
- Discover how a structured system like the ClickBank Super Funnel can automate data collection and remove the uncertainty of manual testing.
- Gain the professional confidence to scale your advertising spend by interpreting real-time data to ensure sustainable and profitable growth.
Why ClickBank Analytics are the Heartbeat of Your Business
If you’ve ever felt like your affiliate business is a series of lucky guesses, it’s time to shift your perspective. In 2026, the most successful entrepreneurs don’t rely on intuition alone; they rely on precision. This evolution toward understanding ClickBank reporting and analytics is essential because it transforms your dashboard from a simple ledger into a powerful diagnostic tool. Instead of just checking if you’ve made a sale, you’re looking for the ‘heartbeat’ of your traffic to see if your business is healthy or if it needs immediate attention.
By 2026, the affiliate space has become more sophisticated, requiring a deeper understanding of affiliate marketing to remain competitive. Real-time reporting isn’t just a luxury; it’s a necessity, especially if you’re promoting high-ticket offers where every click carries significant weight. If you’re only chasing ‘hops,’ you’re likely ignoring the true health of your funnel. The psychological shift from volume to ROI is what allows you to scale with confidence, knowing that every dollar you spend on traffic is actually working for you.
The Evolution of ClickBank Reporting (2024-2026)
ClickBank has made significant strides in how data is presented, moving away from raw event counts that often included duplicate clicks or bot activity. The current dashboard focuses on ‘Unique Events,’ which provides a much more accurate representation of your true audience reach. This shift means you’re seeing how many actual people are interacting with your offers rather than just how many times a link was triggered. If you see your conversion rates looking higher than they did in previous years, it’s often because the data is cleaner. You’re no longer looking at diluted numbers, which makes it easier to spot what’s actually working in your campaigns.
Data as Your Shield Against ‘Never Succeed Online’ Syndrome
Falling into the trap of ‘vanity metrics’ is a fast track to the Never Succeed Online syndrome. If you’re focused on how many people saw your link rather than how many people actually took action, your business isn’t sustainable. Data acts as your shield, protecting you from wasting budget on underperforming ads or offers that don’t resonate. By prioritizing ROI over raw traffic, you build a digital business that can weather market changes and provide long-term stability. Understanding ClickBank reporting and analytics allows you to move beyond the frustration of failure and into a phase of predictable, data-driven growth.
Decoding the 2026 ClickBank Metrics: What Really Matters?
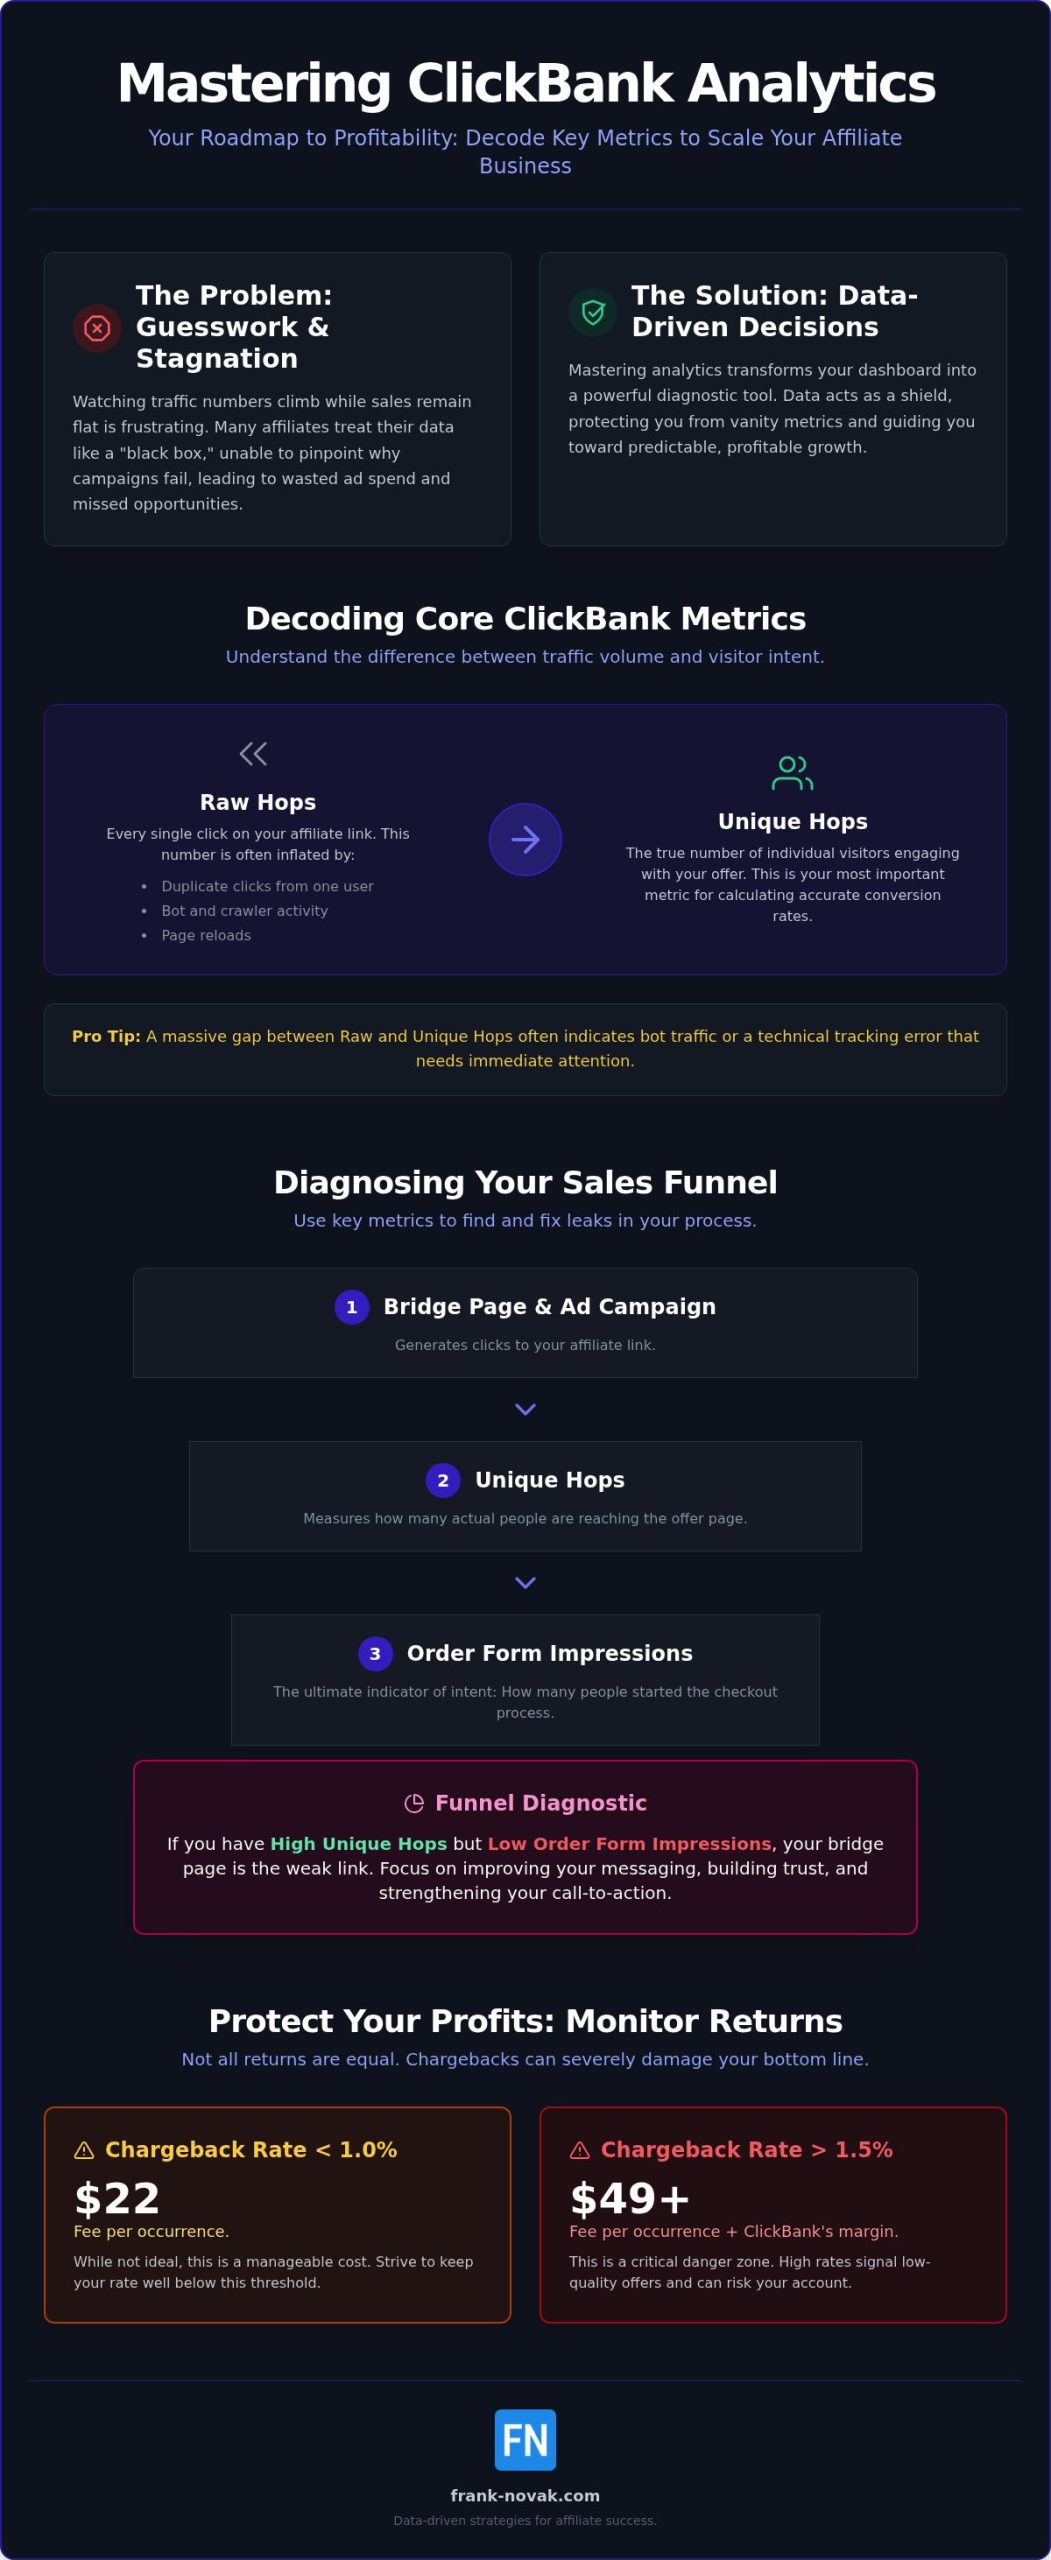
When you first open your reporting tab, the sheer volume of data can feel overwhelming. However, understanding ClickBank reporting and analytics requires looking past the surface numbers to find the story they’re telling about your customers. Raw Hops represent every single click on your link, while Unique Hops filter out duplicates from the same user. If you see a massive gap between these two, it’s often a sign of bot traffic or a technical tracking error that needs your attention.
Beyond hops, your most important indicator of intent is the Order Form Impression. This metric tells you exactly how many people liked your bridge page enough to click through to the vendor’s checkout. If you have high hops but zero impressions, your bridge page is likely failing to build the necessary curiosity or trust. If you’re looking for a structured way to improve these conversion points, Online Success Coaching can provide the personalized insights you need to bridge that gap.
The “Return” field in your dashboard is another area that requires careful monitoring. It’s vital to distinguish between standard refunds and more serious chargebacks. While a refund is a natural part of any business, chargebacks carry heavy penalties. If your chargeback rate is less than 1.0%, you’ll see a $22 fee per occurrence. This fee can climb to $49 plus ClickBank’s margin if your rate exceeds 1.5%, making it essential to choose high-quality products that satisfy your audience.
The Power of Unique Event Metrics
If you base your conversion rate on Raw Hops, your math will always be skewed toward the lower end. Unique Hops provide a much cleaner denominator for your calculations because they represent real individuals engaging with your content. This clarity is vital when you’re evaluating the strength of your bridge page or checking for bot activity. Maintaining transparency is also essential for long-term success; always ensure you’re following FTC disclosure guidelines to build lasting trust with those unique visitors.
Advanced Metrics for Scaling
Average Order Value (AOV) is the north star for scaling your business. If you know that your average commission on a $100 sale is $45.75, you can precisely calculate how much you can afford to spend on Facebook Ads for affiliate marketing. You should also watch your Earnings Per Order (EPO), especially when promoting subscription-based products. For rebills under $40, ClickBank’s wholesale price is 90.1% of the retail price. Tracking these advanced metrics is the only way to gain a deep understanding ClickBank reporting and analytics, ensuring your growth remains both predictable and profitable.
Navigating the ClickBank Reporting Suite: A Step-by-Step Tour
Accessing your data starts with knowing exactly where to look. You have the Primary account level, which gives an overview of all your ventures, and the Nickname level, which is where the granular work happens. If you are promoting multiple niches, the Nickname level is where you’ll spend most of your time understanding ClickBank reporting and analytics. Within this view, the Traffic Report acts as your primary window into visitor origins, helping you see which platforms are sending the most engaged users. The Checkout Report is equally vital because it identifies precisely where potential customers abandon their carts, allowing you to see if the friction is on the vendor’s page or your own pre-sell. Finally, the Earnings Report provides the final word on your actual profit after all fees, such as the $5.00 pay period processing fee, are deducted.
Mastering the Traffic Table and TIDs
Tracking IDs (TIDs) are the secret weapon for any affiliate looking to optimize their traffic. By appending a unique TID to your HopLinks, you can see exactly which specific Facebook ad or email blast is generating sales. It is important to remember the historical ‘Top 150’ rule; the dashboard traditionally groups your tracking data based on the top 150 TIDs. If you exceed this limit, the smaller ones get bundled together, which can make granular analysis difficult. You should also use the Role filter to toggle between your data as an affiliate and a seller. This ensures you aren’t mixing up different revenue streams, which is a common mistake when first understanding ClickBank reporting and analytics at a professional level.
Customizing Your View for Daily Success
Your daily success depends on how you filter and interpret this information. Setting specific date ranges allows you to compare real-time performance against historical averages, helping you spot seasonal trends or sudden dips in conversion. If you need to perform a deeper analysis, exporting your data to a spreadsheet allows you to calculate custom metrics that the dashboard might not show. This level of detail is essential when you’re monitoring the health of an automated marketing funnel. By linking your ClickBank reports to your overall funnel performance, you can see how external traffic sources are impacting your bottom line, giving you the clarity needed to scale your budget without the usual anxiety.
Funnel Diagnostics: Using Analytics to Fix a ‘Leaky’ Business
Identifying why a campaign is failing requires more than just looking at your bank balance; it requires a deep understanding ClickBank reporting and analytics to spot where your visitors are dropping off. Think of your funnel as a pipe carrying water. If you pour 1,000 gallons in one end but only get a cup out the other, you have a leak. In affiliate marketing, these leaks happen at specific transition points. By analyzing your dashboard data, you can stop guessing and start fixing the exact part of your business that’s costing you money.
There are three primary scenarios you’ll likely encounter as you scale:
- Scenario A: High Hops, Low Order Form Impressions. This is the “Bridge Page Leak.” If thousands of people are clicking your link but almost nobody is reaching the checkout page, your pre-sell content isn’t doing its job.
- Scenario B: High Impressions, Low Sales. This is the “Checkout Leak.” If visitors are looking at the order form but refusing to buy, there might be a mismatch in price, a lack of trust, or a technical issue on the vendor’s side.
- Scenario C: High Sales, High Refunds. This is the “Expectation Leak.” While ClickBank withholds a standard 10% return allowance for 12 weeks, a high refund rate suggests the product isn’t living after the sale. You’ll also face a $1.00 fee for every refund on products priced at $10.00 or more, which can quickly eat your margins.
If you find yourself stuck in these patterns, Online Success Coaching can help you read between the lines of your data to find the strategic shortcut to growth.
Troubleshooting the ‘Click-to-Impression’ Gap
The transition from a hop to an impression is where most affiliates lose their audience. If your “Unique Hop to Impression” ratio is low, you likely have a problem with congruence. Congruence is the alignment between ad copy and landing page. If your Facebook ad promises a specific solution but your bridge page talks about something else, visitors will bounce immediately. To improve this, ensure your headlines and imagery remain consistent throughout the entire journey. This level of understanding ClickBank reporting and analytics helps you verify if your messaging actually resonates with the human beings behind the clicks.
Optimizing the Checkout Experience
When you see high unique order form impressions but a low close rate, it’s time to look at the final step. Sometimes, the default vendor checkout page is cluttered or confusing. In these cases, you might ask the vendor for a custom checkout page that mirrors your own branding. You should also use your data to see if your price point is causing friction. If you’re promoting a high-ticket item, a low conversion rate at the checkout might indicate that you haven’t built enough value on your bridge page to justify the cost.
Scaling Your Commissions with the ClickBank Super Funnel
Once you have a firm grasp on understanding ClickBank reporting and analytics, the logical next step is to move away from manual troubleshooting and toward a system that does the heavy lifting for you. The ClickBank Super Funnel is designed to automate the data-collection process, ensuring that every hop and impression is tracked with precision from day one. Instead of spending weeks trying to build a bridge page that might leak traffic, you can plug into a pre-built architecture that has already been optimized for high conversion rates. This approach removes the dangerous guesswork that often leads to inconsistent results, allowing you to focus on scaling your traffic rather than fixing technical errors.
Integrating your analytics with an email list building strategy is where true long-term growth happens. While a single sale is great, a subscriber who trusts your recommendations is an asset that pays dividends for years. By monitoring your unique order form impressions alongside your email opt-in rates, you can see exactly how well your funnel is performing at every stage. This transition from a simple analyst to an automated business owner is what separates the hobbyists from the professionals. You’re no longer just chasing a one-time 75% commission; you’re building a sustainable engine that generates revenue predictably and allows you to scale your ad spend with absolute certainty.
The Advantage of a Pre-Built System
Using a pre-built system ensures that your metrics remain consistent across different niches, whether you’re in health, wealth, or relationships. If you try to build everything yourself, you’ll likely spend more time managing spreadsheets than engaging in income-producing activities. By leveraging Online Success Coaching, you get the added benefit of a seasoned practitioner helping you read between the lines of your specific data trends. This mentorship helps you understand if a dip in sales is a market trend or a specific funnel issue, saving you from making reactive decisions that could hurt your ROI. When you have a professional guide, understanding ClickBank reporting and analytics becomes a strategic advantage rather than a daily chore.
Building a Sustainable Growth Engine
A professional digital business requires a balance of high-volume offers and high-ticket commissions to remain profitable in 2026. When your dashboard shows a high Average Order Value, it gives you the financial breathing room to invest more into your growth. Transitioning from a side hustle to a professional operation means treating your analytics like a flight deck; you need to know exactly which levers to pull to reach your destination. If you’re ready to stop guessing and start scaling with a proven roadmap, Join the ClickBank Super Funnel today.
Mastering Your Digital Growth Roadmap
Transitioning from a series of lucky guesses to a data-driven strategy is the most significant step you can take for your professional future. We’ve explored how identifying funnel leaks and monitoring unique event metrics can transform your dashboard into a powerful diagnostic tool. By prioritizing a deep understanding ClickBank reporting and analytics, you move away from the uncertainty of vanity metrics and toward a business model built on real-time ROI.
Frank Novak’s experience in business automation and Facebook traffic generation provides the solid foundation you need to scale with confidence. Whether you’re troubleshooting a bridge page or looking for personalized growth through Online Success Coaching, having a clear roadmap makes all the difference. You now have the tools to identify every leak and optimize every click for maximum impact.
Scale your commissions with the ClickBank Super Funnel
The journey toward affiliate success is a marathon, not a sprint, and you’re now better equipped to navigate the path ahead. Stay focused on the data, keep refining your process, and remember that every small adjustment brings you one step closer to your ultimate goals.
Frequently Asked Questions
What is the difference between a Hop and a Unique Hop on ClickBank?
A Hop represents every time someone clicks your affiliate link, while a Unique Hop counts only the first click from a specific visitor within a 24 hour period. If one person clicks your link five times, you’ll see five Hops but only one Unique Hop. Understanding this distinction is vital for accurately calculating your conversion rates and identifying potential bot activity that might be inflating your raw traffic numbers.
Why does my ClickBank conversion rate look different than my Google Analytics?
Discrepancies usually happen because Google Analytics tracks sessions on your bridge page, while ClickBank tracks the moment someone clicks through to the vendor’s site. Differences in cookie handling, ad blockers, and bot filtering between the two platforms can also cause the numbers to vary. This is why understanding ClickBank reporting and analytics as your primary source of truth for actual sales and hop data is essential for your business.
How often does ClickBank update its reporting data?
Reporting occurs in real time, meaning sales and hops are visible on your dashboard almost as soon as they happen. While most transaction data is updated instantly, some of the more complex analytical breakdowns or niche reports might experience a very slight delay. This real-time access allows you to make quick adjustments to your Facebook ad campaigns or automated marketing systems based on current, accurate performance data.
What is a ‘good’ conversion rate for a ClickBank offer in 2026?
A “good” conversion rate varies significantly depending on your traffic source and the price of the offer. For cold traffic in 2026, a 1% to 3% conversion rate from unique hops is often considered a healthy benchmark for standard digital products. High-ticket offers may convert at a lower percentage, but they often provide a much better ROI due to the significantly higher commission payouts per successful sale you generate.
Can I track which specific Facebook ad generated a ClickBank sale?
You can absolutely track specific Facebook ads by utilizing Tracking IDs, or TIDs, at the end of your affiliate links. By assigning a unique TID to each individual ad or creative version, you can see exactly which one is driving the most profitable traffic. This granular level of detail is a key part of understanding ClickBank reporting and analytics, enabling you to scale your winning ads while pausing those that don’t convert.
What should I do if my refund rate is higher than 10%?
If your refund rate exceeds 10%, you should immediately evaluate the quality of the product or the messaging on your bridge page. High refund rates can lead to additional fees, such as the $1.00 charge for returns on products priced at $10.00 or more. If the product isn’t meeting customer expectations, it’s often better to pivot to a higher quality offer that aligns more closely with the promises made in your marketing.
How do I see which Tracking ID (TID) is performing the best?
To identify your best performing TID, navigate to the Reporting tab at the Nickname level and select the Traffic report. You can then filter or group the results by TID to see a side by side comparison of hops, impressions, and sales for each tracking code. This view helps you determine which traffic sources or specific marketing assets are delivering the highest quality visitors and the most consistent sales commissions.
What is EPO and why should affiliates care about it?
EPO stands for Earnings Per Order, and it represents the average commission you earn every time a customer completes a purchase. Affiliates should care about this metric because it directly informs how much they can afford to spend on customer acquisition. If you know your average earnings after ClickBank’s fees are deducted, you can set your advertising budget with the professional confidence that your automated campaigns will remain profitable and sustainable.

Article by
Frank Novak
Frank Novak is an online marketing professional and coach who focuses on affiliate marketing and business automation. Through his website, frank-novak.com, he shares insights and strategies for leveraging social media platforms like Facebook to generate traffic and commissions.
Affiliate / Sponsored Content Disclaimer
This [website/post] contains affiliate links. If you click through and make a purchase, we may receive a commission at no additional cost to you. We only recommend products or services we believe will add value to our readers.