
Did you know that the global affiliate marketing industry is now valued at $17 billion, yet many marketers still struggle to figure out how to use ClickBank insights tool to identify which link click actually paid for their dinner? It’s a common challenge to feel buried under a mountain of raw data while trying to distinguish between simple clicks and the unique events that truly matter for your bottom line. If you’ve ever felt confused about how a sudden refund affects your net earnings or which traffic source is truly driving your ROI, you’re certainly not alone in that frustration. Understanding these numbers is often the only thing standing between an affiliate hobbyist and a professional entrepreneur.
This guide is designed to help you master the Sales Analytics Report so you can decode your traffic and optimize your funnel with CEO-level precision. By mastering these metrics, you’ll learn to identify your winning campaigns instantly and stop wasting money on ads that don’t perform. We’ll explore the mechanics of real-time reporting and show you how to turn raw numbers into a predictable, automated income stream. If you’re ready to move past the guesswork, let’s look at how these strategic insights can transform your affiliate business starting today.
Key Takeaways
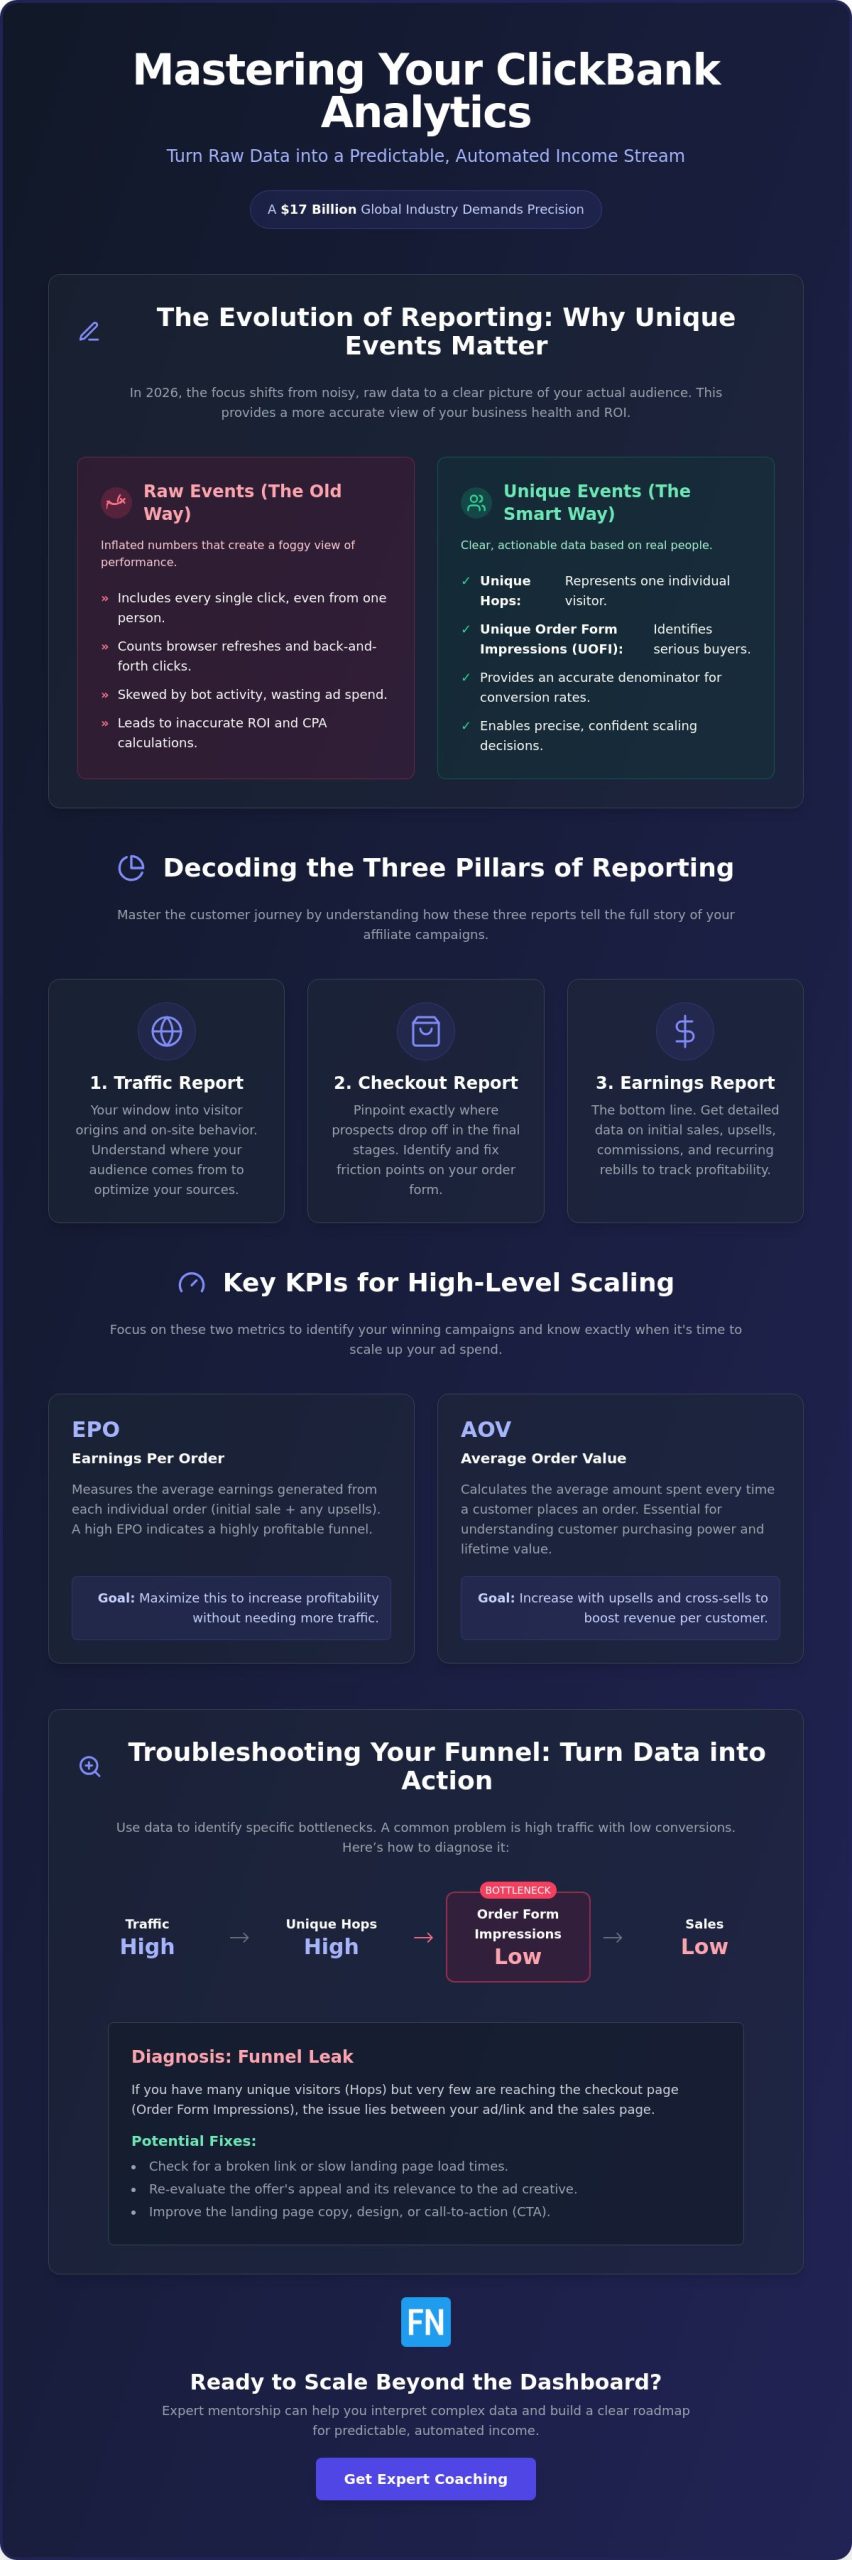
- Learn why shifting your focus from raw event counts to unique events provides a more accurate picture of your actual audience reach and engagement.
- Discover how to use ClickBank insights tool to navigate traffic, checkout, and earnings reports to pinpoint exactly where your visitors are coming from.
- Master Key Performance Indicators like Earnings Per Order (EPO) and Average Order Value (AOV) to identify which campaigns are ready for high-level scaling.
- Identify specific funnel bottlenecks, such as high hop counts with low order form impressions, and apply targeted fixes to improve your conversion rates.
- Understand how expert mentorship can help you interpret complex dashboard data and build a clear roadmap for a predictable, automated income stream.
The Evolution of ClickBank Reporting: Why Unique Events Matter in 2026
The way we analyze affiliate data has fundamentally changed over the last few years. If you are learning how to use ClickBank insights tool in 2026, you’ll notice a significant shift toward unique event reporting. This isn’t just a minor technical update. It’s a strategic evolution for the ClickBank e-commerce platform that helps you see through the fog of raw data. In the past, marketers were often misled by “raw” counts that included every single click, even if one person clicked your link ten times. By focusing on unique events, you get a much clearer picture of your actual audience reach and your true business health.
To better understand these core concepts and see the platform in action, watch this helpful video from ClickBank:
Because ClickBank now prioritizes unique data in its Sales Analytics Report, your conversion rates might actually appear higher than they did in previous years. This doesn’t necessarily mean your traffic has magically improved. Instead, it means the “denominator” in your math is finally accurate. Relying on raw data is a dangerous game when you’re calculating ad spend ROI. If you count 500 raw clicks but only have 100 unique visitors, your cost per acquisition (CPA) calculations will be completely skewed. This often leads to wasted budget on campaigns that look busy but aren’t actually profitable.
Unique Hops vs. Raw Clicks
A “Unique Hop” represents an individual visitor rather than the total number of click events recorded by the server. Raw clicks are frequently inflated by users refreshing their browser, clicking back and forth, or even automated bot activity that doesn’t represent a real human being. If you only look at raw clicks, you might think a campaign is booming when it’s actually just a few very indecisive shoppers. A Unique Hop is the industry standard for 2026 performance. This metric ensures you’re making scaling decisions based on real people, not just digital noise.
Unique Order Form Impressions (UOFI)
Tracking individual checkout views through Unique Order Form Impressions (UOFI) is the ultimate test for your funnel health. This metric removes the “noise” created by shoppers who might click the buy button several times due to a slow connection or simple hesitation. By looking at UOFI, you can easily distinguish between “window shoppers” and serious buyers who are truly considering the offer. If your UOFI is high but your sales are low, you know exactly where the friction is. It’s likely an issue with the checkout page layout or a lack of trust at the final step.
Decoding the Three Pillars: Traffic, Checkout, and Earnings Reports
Learning how to use ClickBank insights tool starts with navigating the two distinct levels of reporting. Your primary account dashboard provides a broad overview of your entire portfolio, but the account nickname level is where you find the granular data needed for daily optimization. By using the Role Selector, you can toggle between “Affiliate” and “Seller” views. This keeps your interface clean and focused on the essential digital marketing metrics that matter most for your current task. If you’re promoting multiple products across different niches, this separation is vital for maintaining a clear head.
The reporting system is built on three pillars that reflect the customer journey. The Traffic Report acts as your window into visitor origin and behavior. The Checkout Report helps pinpoint exactly where prospects drop off in the final stages of the purchase. Finally, the Earnings Report breaks down your bottom line, including detailed data on commissions and recurring rebills. If you want to scale effectively, you need to see how these three reports interact to tell the full story of your funnel.
The Traffic Table: Mastering TIDs for Attribution
Tracking IDs (TIDs) are the lifeblood of attribution. They allow you to identify which specific Facebook ad set, YouTube video, or email blast is actually putting money in your pocket. If you’re following a strategic guide for driving traffic to affiliate links, you’ll know that data-driven decisions require perfect attribution. It’s helpful to remember that ClickBank displays the top 150 TIDs individually in your reports. Any traffic beyond that limit is grouped into an “Other” category. If you want to keep your most important campaigns visible, it’s wise to consolidate your tracking labels rather than creating thousands of unique tags.
The Checkout Table: Analyzing Form Abandonment
This table is where you calculate your “Click-to-Impression” ratio to judge landing page effectiveness. If you have thousands of hops but very few order form impressions, your bridge page isn’t doing its job of warming up the lead. You can also use this data to identify technical friction points. If a specific browser shows a high abandonment rate, there might be a loading issue on the order form. If you’re looking for a way to streamline this entire process and minimize friction, the ClickBank Super Funnel can help align your traffic with the right offers automatically. Using this data allows you to fix leaks in your funnel before you scale your ad spend.
Key Performance Indicators (KPIs) for Scaling to Six Figures
Scaling an affiliate business isn’t about working harder. It’s about understanding the specific math that drives your growth. Once you’ve mastered the basics of how to use ClickBank insights tool, you can move from general observation to precision scaling. The most successful entrepreneurs focus on Earnings Per Order (EPO) to determine the true value of every customer they refer. This metric is far more telling than a simple commission check because it accounts for the entire transaction, including any upsells the vendor might have in place. If a vendor has a high Average Order Value (AOV), you can afford to bid more on your traffic while still maintaining a healthy profit margin.
You also need to distinguish between your initial commission and resell commissions. The initial commission is what you earn on the front-end sale, but the resell commission covers the long-term value of that single lead through recurring subscriptions or backend offers. Understanding this distinction helps you see your business as a long-term asset rather than a series of one-off sales. It’s much easier to build a sustainable income when you know that a single customer might pay you for months or even years to come.
EPO with Rebills: The Passive Income Metric
To calculate the total lifetime value of a recurring commission product, you must look at your EPO with rebills included. This is the ultimate passive income metric. Sometimes a product might have a low initial EPO that looks discouraging at first glance. However, if the rebill rate is high, that offer could be significantly more profitable over six months than a high-ticket item with no recurring component. If you’re looking to build an automated marketing funnel, focusing on products with strong rebill data is the most reliable way to ensure sustainable business growth. This data allows you to plan your budget with confidence, knowing exactly when your “break-even” point will occur.
The “Return” Field: Managing Your Risk
Protecting your account is just as important as generating sales. ClickBank provides a 365-day reporting window for returns and chargebacks, which gives you a comprehensive view of how your chosen products perform over time. It’s vital to monitor the “Return” fields to identify high-risk products that might inflate your daily earnings but result in heavy refunds later. Often, high refund rates are a sign of poor product quality or misleading marketing. To maintain trust with your audience and stay compliant with FTC endorsement guidelines, always ensure your bridge pages accurately represent the offer. A return rate over 10 percent requires an immediate niche audit. By staying proactive with this data, you can pivot away from low-quality offers before they damage your reputation or your standing with the network.
Troubleshooting Your Funnel: Turning Data into Action
Data tells a story, but it’s your job to write the ending. Once you understand how to use ClickBank insights tool, you can move from simply watching your dashboard to actively steering your results. Real-time reporting is your best defense against wasted ad spend because it allows you to spot “bleeding” campaigns before they drain your daily budget. If you notice a campaign is failing to hit your target metrics, you have the power to pause it immediately rather than waiting for a weekly summary to see the damage. Effective troubleshooting is what separates those who gamble on traffic from those who invest in it.
When you encounter a hurdle in your funnel, the data usually points toward one of three common scenarios:
- Scenario A: High Hops but Low Order Form Impressions. This indicates a “Landing Page Leak.” People are curious enough to click your ad, but your bridge page isn’t doing enough work to sell them on the next step.
- Scenario B: High Impressions but Zero Sales. This is an “Offer Alignment” issue. Your audience is ready to buy, but something on the checkout page or the product itself is causing a last-minute change of heart.
- Scenario C: Sales are occurring but ROI is negative. The problem here is “Traffic Quality.” You’re finding buyers, but you’re paying more to acquire them than they’re worth in commissions.
Fixing the Landing Page Leak
Using the Checkout Report is the fastest way to see if users are actually reaching the “Buy” button. If your “Unique Hops” are high but they don’t convert to impressions, it’s time to test a new headline or a more compelling call-to-action. Sometimes a simple color change on a button or a clearer explanation of the benefits can plug the leak. If you’re tired of manually fixing these technical gaps, the ClickBank Super Funnel provides a pre-optimized structure that aligns your traffic with the right offers automatically.
Optimizing Traffic Quality via TIDs
Tracking IDs (TIDs) are your most powerful tool for isolating junk traffic. By using specific TIDs for different Facebook interests or ad creatives, you can see exactly which segments are producing “junk” hops that never convert. You should focus on scaling the specific TIDs that show a high EPO with minimal refunds. Maintaining consistent naming conventions for your tracking links is vital so your data stays organized as your business grows. If you want a steady hand to help you navigate these data-driven pivots, you can explore Online Success Coaching to get a professional perspective on your specific funnel strategy.
Scaling Beyond the Dashboard: The Role of Expert Coaching
While the previous sections have shown you exactly how to use ClickBank insights tool to monitor your funnel, there is a limit to what a dashboard can do. A report shows you exactly where you are today, but it cannot tell you where to go next. Moving from an affiliate marketer to a business owner requires more than just reading numbers; it requires the ability to execute a long-term automation strategy. This is where the gap between raw data and true financial freedom is often bridged. If you find yourself spending more time analyzing data than making strategic moves, you might be hitting a plateau that only an external perspective can break.
The transition from a data reader to a business executor is much smoother when you have a guide who has already walked the path. A dashboard is a map, but a mentor is the navigator who helps you avoid the roadblocks that don’t appear on the screen. By focusing on the big picture, you can stop reacting to every minor fluctuation and start building a business that scales with intent.
The Advantage of Professional Mentorship
Analysis paralysis is a real threat when you spend all day staring at fluctuating percentages. Professional mentorship provides the perspective needed to stop overthinking every minor dip in traffic. A seasoned practitioner who has analyzed thousands of funnels can recognize hidden patterns in ClickBank data that a beginner might miss. For example, they might spot a specific trend in refund timing that signals a product is losing its market relevance before it becomes a major problem. If you want to move faster, understanding why Online Success Coaching is your shortcut to growth in 2026 can help you bypass months of trial and error. This type of guidance turns a confusing spreadsheet into a clear, actionable roadmap.
Automating Your Growth in 2026
Scaling in 2026 also means looking at how your data integrates with the wider digital ecosystem. Once you understand how to use ClickBank insights tool to identify your best traffic, you can connect those analytics with third-party automation tools. This allows you to build systems that adjust your ad spend or trigger email sequences based on proven performance metrics. These automated systems allow your business to run on autopilot, freeing you from the need to check your dashboard every hour. Once you have a data-backed roadmap, the goal is to spend less time in the reporting tab and more time expanding into new markets. Building a business that works for you is the ultimate goal of mastering these reporting tools. To get started with a system that has these efficiencies built in, you can join the ClickBank Super Funnel to automate your path to success.
Building Your Data-Driven Future on ClickBank
Mastering the Sales Analytics Report is the first step toward building a truly sustainable business. By prioritizing unique events over raw clicks, you’ve learned to see the real people behind the numbers. We’ve explored how to identify leaks in your funnel and how to use ClickBank insights tool to optimize your ROI with precision. However, the most successful entrepreneurs know that data is only as good as the strategy behind it. If you’re ready to stop guessing and start scaling with high-ticket automation and 2026 compliance strategies, professional guidance is the logical next step. Mentorship from a seasoned practitioner can help you translate these metrics into a consistent, scalable income stream.
The path to professional growth is much shorter when you have a clear roadmap and a steady hand to guide you. You’ve already done the hard work of learning the systems; now it’s time to put that knowledge to work for your future. You’ve got the tools and the talent to succeed, and the next level of your journey is waiting for you to take the lead.
Frequently Asked Questions
What is the difference between Raw Hops and Unique Hops on ClickBank?
Raw Hops represent the total number of times your link was clicked, whereas Unique Hops identify individual visitors. If a single person clicks your link multiple times, it will record multiple raw hops but only one unique hop. Unique Hops are the more reliable metric for measuring your actual audience reach. Focusing on unique data helps you avoid the confusion caused by bot traffic or accidental double-clicks from users.
Why is my ClickBank conversion rate suddenly higher in 2026?
Your conversion rate likely appears higher because ClickBank now uses unique events rather than raw counts for its calculations. When the denominator of your conversion math is based on unique visitors, the resulting percentage naturally increases. This shift provides a more realistic view of your success. It ensures that your data isn’t being diluted by repetitive clicks from the same few people who haven’t made a purchase decision yet.
How far back does ClickBank sales reporting data go?
ClickBank sales reporting data is available for the most recent 365 days. The platform updates this information in real-time to ensure you always have the latest figures for your active campaigns. If you need to keep records for longer periods, it’s a good practice to export your reports monthly. This ensures you have a historical archive of your performance to compare year-over-year growth as your business scales.
What is a “good” Earnings Per Order (EPO) for a beginner?
A solid Earnings Per Order (EPO) for a beginner is typically anything above $1.00, though this can vary significantly depending on your specific niche. As you master how to use ClickBank insights tool, you’ll find that focusing on high-ticket or recurring rebill products can push this number much higher. High-performing affiliates often aim for an EPO that comfortably covers their traffic costs while leaving a healthy margin for profit.
How do I track which Facebook ad resulted in a specific sale?
You can track specific Facebook ads by adding unique Tracking IDs (TIDs) to the end of each HopLink you use in your campaigns. When a sale is made, the TID associated with that specific ad will show up in your reporting dashboard. This allows you to see exactly which creative or interest group is driving your revenue. It’s the most effective way to isolate winning ads and stop spending money on those that don’t convert.
What should I do if my refund rate is consistently high?
If your refund rate is consistently above 10 percent, you should perform an immediate niche audit to identify the cause of the friction. High refunds often suggest that your bridge page is over-promising or that the product quality doesn’t meet customer expectations. You might need to adjust your marketing angle to better align with the actual offer. If the product itself is the problem, it’s often safer to pivot to a higher-quality vendor.
Can I see real-time data in my ClickBank analytics dashboard?
Yes, the ClickBank analytics dashboard provides real-time data updates for your traffic and sales events. This immediate feedback is vital for troubleshooting your funnel and making quick adjustments to your ad spend. By watching your reports as traffic flows in, you can catch technical errors or poor-performing ads before they waste your budget. It’s a powerful way to stay in control of your business daily operations.
Where can I find my rebill and subscription statistics?
Rebill and subscription statistics are located within the Earnings Report section of your Sales Analytics dashboard. You can easily filter your results to show recurring commissions, which helps you understand the long-term value of your leads. Learning how to use ClickBank insights tool to track these rebills is essential for building a predictable income stream. It shows you which products have the best retention rates and provide the most sustainable passive growth.

Article by
Frank Novak
Frank Novak is an online marketing professional and coach who focuses on affiliate marketing and business automation. Through his website, frank-novak.com, he shares insights and strategies for leveraging social media platforms like Facebook to generate traffic and commissions.
Affiliate / Sponsored Content Disclaimer
This [website/post] contains affiliate links. If you click through and make a purchase, we may receive a commission at no additional cost to you. We only recommend products or services we believe will add value to our readers.