

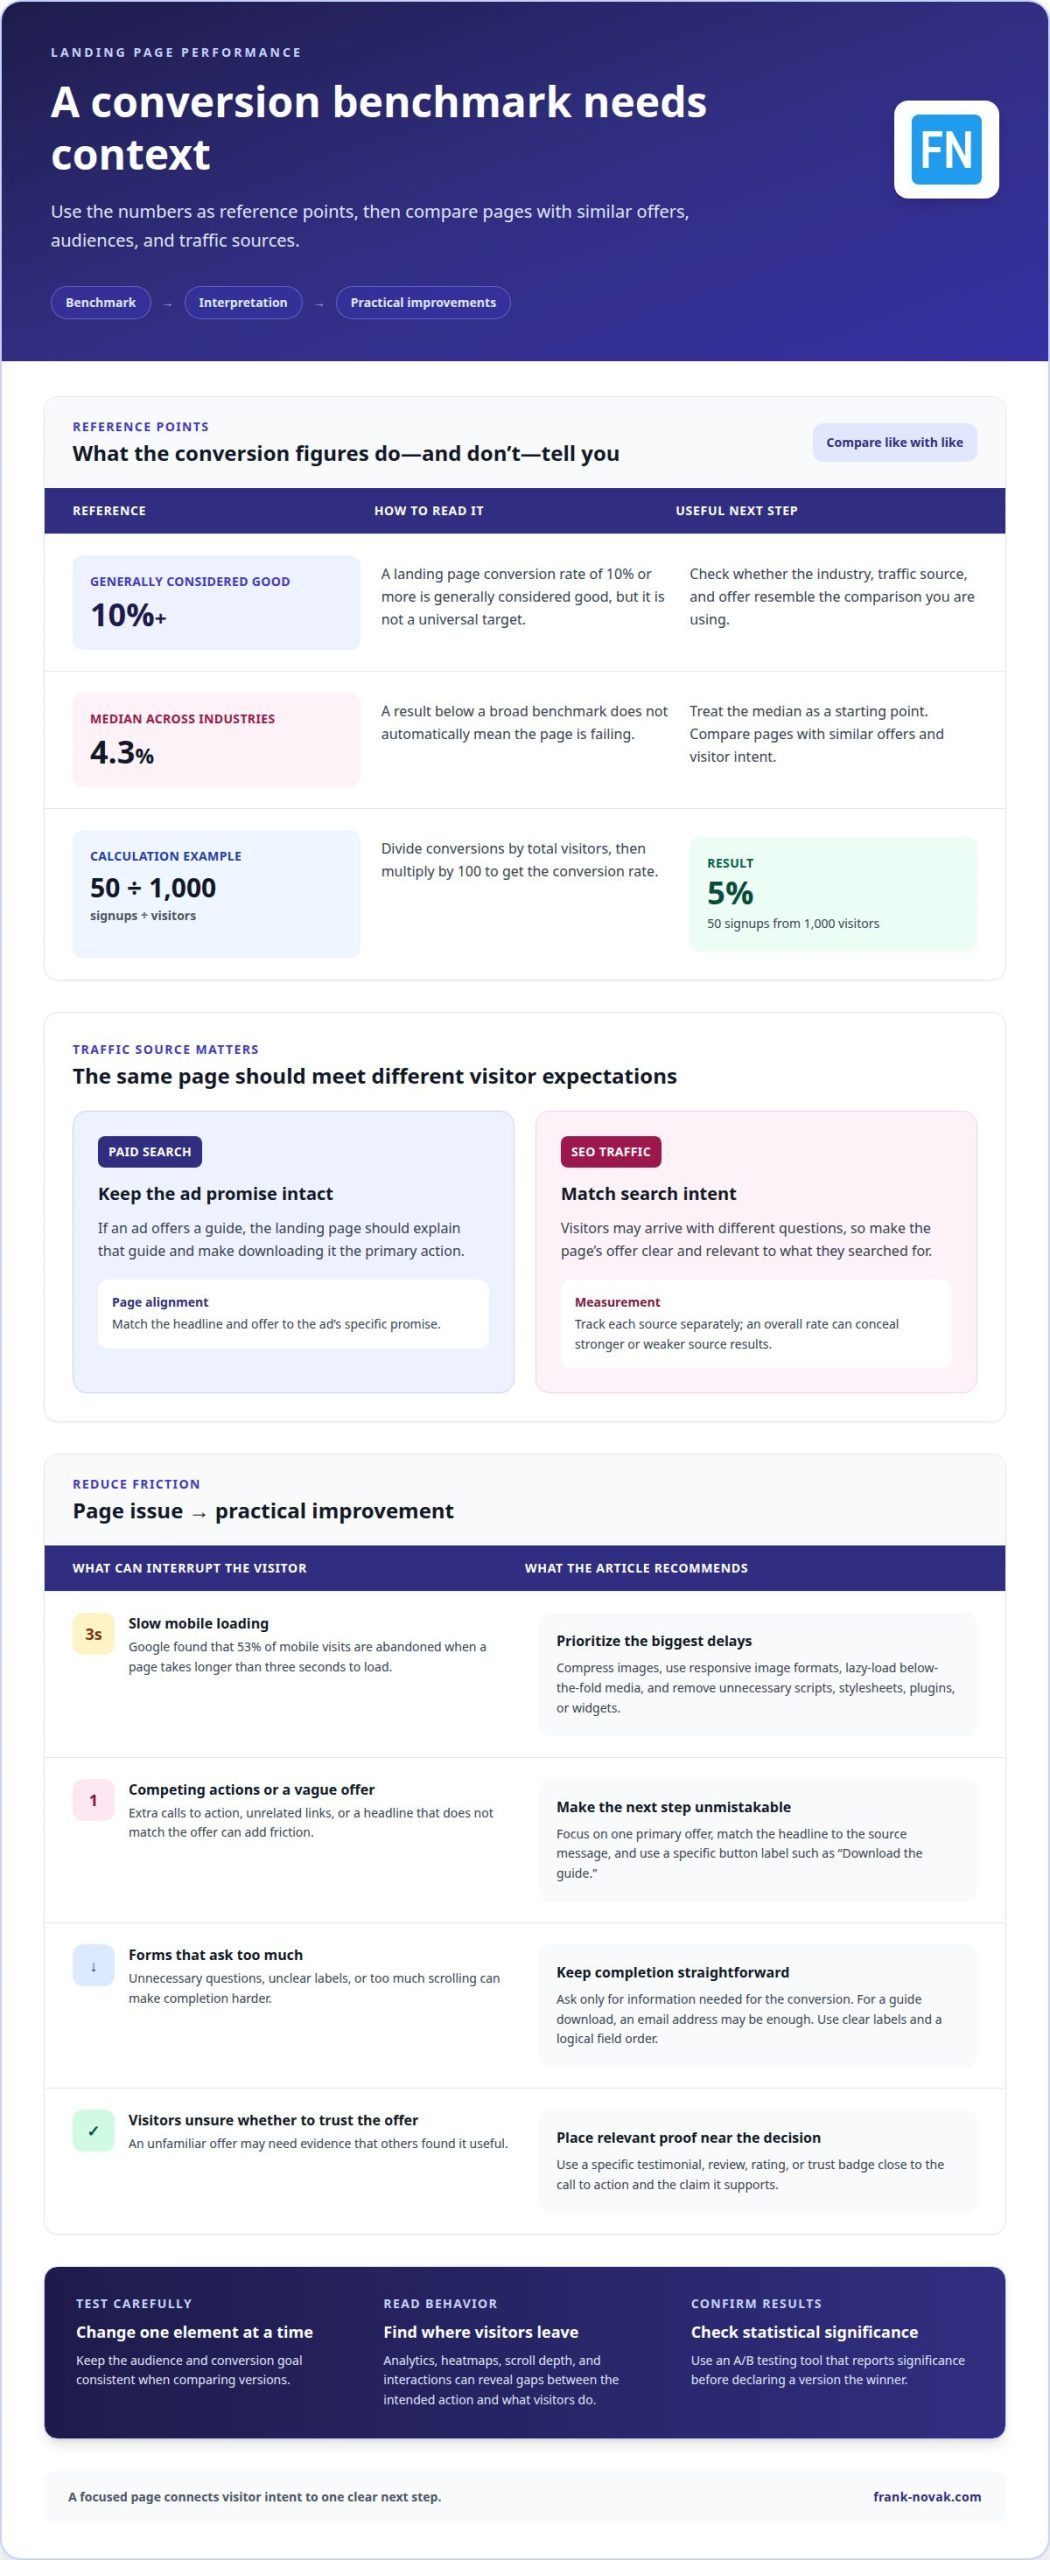
A landing page conversion rate of 10% or more is generally considered good, though the right benchmark depends on your industry, traffic source, and offer. To understand how to improve landing page conversion rates, first calculate yours: divide conversions by total visitors and multiply by 100. For example, 50 signups from 1,000 visitors equals a 5% conversion rate.
A rate below a broad benchmark doesn’t automatically mean your page is failing. The page’s purpose and audience matter, so a benchmark for a similar industry, offer, and traffic source is a more useful starting point than one universal target.
This guide explains how to calculate your rate, interpret benchmarks, and identify practical improvements. You’ll also learn how page speed and social proof affect the visitor experience, so you can focus on making your offer clear and easy to act on.
Key Takeaways
- Compare your results with benchmarks that fit your industry and traffic source, rather than relying on one universal target.
- Make your call to action clear, easy to find, and focused on the next step you want visitors to take.
- Spot page-speed issues that may interrupt visitors, then prioritize practical ways to make the page load faster.
- Use relevant testimonials, reviews, or trust signals near your call to action to help visitors assess your offer.
- Learn how to calculate conversion rate and use the result to guide meaningful landing page improvements.
1. What is a good landing page conversion rate?
A landing page conversion rate of 10% or more is generally considered good, but industry and visitor intent shape the comparison. The median across industries is around 4.3%, so a lower rate doesn’t automatically mean a page is failing. Compare pages with similar offers and traffic sources, then look for changes that make the desired action easier.
Start with the promise that brought visitors to the page. If a paid search ad offers a guide, the landing page should explain that guide and make downloading it the main action. Asking visitors to book a call, subscribe, and explore unrelated products adds friction. Give the page one primary offer, then remove navigation links or extra images that compete with it.
Focus first on the headline, offer, form, page speed, and call to action. Match the headline to the source message, ask only for necessary details, and label the button with the next step, such as “Download the guide.” Place relevant testimonials or trust signals near the action, where they help visitors assess the offer. This alignment is a practical starting point for improving landing page conversion rates.
To A/B test a landing page, change one element at a time, such as the headline or button wording, and compare conversions between versions. Statistical significance indicates whether an observed difference is unlikely to be random; use an A/B testing tool that reports it before declaring a winner. Keep the audience and conversion goal consistent so the comparison is meaningful.
Analytics can show where visitors leave, while heatmaps reveal which areas attract clicks and attention. Review the path from landing to conversion, then compare scroll depth and interactions with the intended action. If visitors click an image that isn’t clickable or rarely reach the form, adjust the layout or move the action into a more visible position.
Common mistakes include a vague headline, competing calls to action, a long form, and claims that don’t match the offer. A button labeled “Submit,” for example, gives less context than “Get the checklist.” Remove unnecessary links, keep the promise consistent, and place proof near the decision point.
For paid search, align the page headline and offer with the ad’s specific promise. For SEO traffic, match the page to search intent and explain the offer clearly, since visitors may arrive with different questions. Track each source separately: an overall rate can hide a strong result from one source and a weaker one from another.
When deciding how to improve landing page conversion rates, use a benchmark as a starting point, not a target that overrides relevance. A focused page with one clear action gives visitors a direct route from interest to conversion.
2. Page load speed
A slow page adds friction before visitors can even consider an offer. Google found that 53% of mobile visits are abandoned when a page takes longer than three seconds to load. That makes loading performance part of the visitor experience, not simply a technical detail. A faster page helps people reach the content and action they came to find.
To improve landing page speed and mobile usability, test the page on a phone and identify its biggest delays. Compress image files, use responsive image formats for different screen sizes, and lazy-load images or videos below the fold. Then remove unnecessary scripts, stylesheets, plugins, and widgets that delay the content visitors need first.
Make the visual design purposeful. A large hero image can communicate the offer, but an oversized file may slow loading without adding useful context. Choose images that support the audience’s decision, resize them for their display area, and avoid loading elements visitors may never see. Effective landing page optimization balances persuasive visuals with efficient delivery.
On mobile, small text, cramped buttons, and forms that require too much scrolling can create friction. Use a responsive layout, make form fields comfortable to tap, and keep labels visible as visitors enter information. A fast-loading page still creates barriers if the next step is difficult, so review speed and usability together.
Ask only for information needed for the specific conversion. For a guide download, an email address may be enough; unrelated questions can make completion feel like unnecessary work. Use clear labels, logical field order, and a prominent submit button. Remove optional fields that don’t help deliver the offer or follow up appropriately.
Page performance depends on more than image size. A content delivery network can serve files through distributed servers, while streamlined code can reduce unnecessary requests. Combining stylesheets and scripts, minifying files, and removing unused code can reduce the work a browser must do. Recheck the page after each change to ensure it hasn’t disrupted forms or other functions.
Measure the experience on mobile and desktop, then prioritize the slowest or most disruptive elements. If a video sits near the top, test whether delaying its load helps the main message appear sooner. If visitors encounter a blank space before the form, inspect the scripts and images causing the delay.
For broader online business guidance alongside practical optimization, explore online marketing resources.
3. Social proof
Visitors considering an unfamiliar offer often look for evidence that others found it useful. Social proof can provide context through customer testimonials, reviews, ratings, or trust badges. Choose evidence that matches the audience and offer. A testimonial about a specific benefit is more useful than a general compliment because readers can relate it to their own decision.
Placement matters. Put a short testimonial or relevant rating near the call to action, where it supports the decision without interrupting the page. For example, a page offering a planning guide could place a reader’s comment about using the guide beside its download button. Keep proof close to the claim it supports, so visitors don’t have to search for context.
Social proof should be clear and credible. Use a person’s name or role when you have permission, and preserve the meaning of their original words. If a review describes one feature, don’t present it as proof of a different result. Specific, relevant evidence that matches the headline and page copy builds trust.
Make each trust signal earn its space. A customer rating, testimonial, or recognizable trust badge can answer a concern, but unrelated badges can clutter the design. Choose elements that address the target visitor’s likely hesitation. For a digital course, a learner’s comment about the lessons may be more relevant than a general statement about customer service.
Social proof can support conversion optimization, but it should be evaluated alongside the rest of the page. Unbounce reports a 1% difference in conversion between pages that include social proof and pages that do not. Landing pages with social proof within the copy had an average conversion rate of 12.5%. These figures offer context, not a guaranteed outcome for every audience or offer.
Test which proof helps visitors make a decision. Keep the main page and offer consistent, then compare a version with a testimonial against one without it. You can also test its placement, such as beside the call to action or lower on the page. Track conversions and relevant engagement, rather than treating clicks on a testimonial as the final goal.
During optimization, review the full journey from the promise to the proof and then to the action. If a testimonial supports a claim but the page’s offer contradicts it, resolve that mismatch first. If the evidence is accurate and visible, it can reduce uncertainty while keeping the page focused on one clear next step.
4. Landing page conversion rate definition and calculation
A landing page conversion rate shows the share of visitors who complete the page’s intended action. Calculate it by dividing conversions by visitors, then multiplying by 100. For example, 10 completed signups from 200 visitors gives a 5% rate. Count completed actions, not button clicks, so the figure reflects the result the page is designed to produce.
Define the conversion event before measuring results. A page offering a downloadable guide might count a completed form submission, while a webinar page could count a completed registration. Don’t combine these actions under one conversion label. Consistent definitions make the rate useful for comparing page versions and assessing whether a change helped.
Build a baseline by recording visitors and conversions over a consistent period. Keep the page, conversion event, and campaign source aligned in each comparison. For example, separate paid search from organic search if visitors arrive with different intent. Improving landing page conversion rates starts with knowing which group and action the calculation represents.
Benchmarks vary by landing page type. Pages with one link have an average conversion rate of 13.5%; pages with two to four links average 11.9%, and pages with five or more links average 10.5%. Use these figures to frame a question about page structure, not as a target that every offer must reach.
Other benchmarks reflect different actions and traffic contexts. One reported rate for landing pages among signup form types is 23%, while PPC search traffic has a benchmark around 10.9%. A signup form and a paid search campaign may attract visitors with different expectations. Compare a page with a similar goal before drawing conclusions from either figure.
To interpret your baseline, group results by goal, audience, and traffic source. Compare a webinar registration page with other registration pages, not product purchase pages. The actions involve different commitments, which affect visitor behavior. Your own earlier results provide another reference point when an industry benchmark doesn’t closely match the page.
After measuring the baseline, change one meaningful element and record the outcome. If you add social proof, for example, keep the offer and traffic source stable while tracking completed actions. Link a specific adjustment to a measurable result to decide how to improve landing page conversion rates.
Conversion rate is most useful alongside visitor volume and conversion quality. If the rate changes while the audience mix also changes, account for both factors before choosing the next test. This context turns the calculation into a practical decision rather than a score viewed on its own.
5. Average conversion rates by industry
A useful benchmark depends on the page’s industry, conversion goal, and traffic source. HubSpot reports an average landing page conversion rate of 5.89% across industries. That overall figure offers context, but it can hide meaningful differences between a webinar signup, a product purchase, and a business lead form.
For lead generation landing pages, average conversion rates range from 9% to 12%. Webinar registration pages have averages of 20% to 40%, reflecting a different action and level of commitment. Ecommerce product pages average 2% to 5%, while ecommerce conversion rates overall average 2.5% to 3.5%. Compare the page with the closest matching goal.
Industry figures also vary by how results are summarized. The median landing page conversion rate for SaaS is 3.8% using 2024 data, while the median for financial services is 8.4% using 2024 data. B2B landing pages have a median rate of 13.3% in 2026. A median and an average describe different measures, so don’t treat them as interchangeable targets.
Traffic source adds another useful comparison. Paid social traffic has an average landing page conversion rate of 12.0%, while display ads typically produce rates of 4% to 5%. These figures show why an overall page rate may not reflect the actual performance of each campaign. Separate paid social, display, and other traffic when reviewing results.
Use the benchmark as a diagnostic, not a pass-or-fail score. If an ecommerce page sits below the 2% to 5% range, inspect whether the product, headline, and call to action match visitor intent. If a webinar page converts below its 20% to 40% average, review the registration process and the promise made before signup. Each comparison should lead to a testable question.
For a practical comparison, group results by industry, page type, and traffic source. Keep the conversion action consistent, such as a completed registration rather than a button click. Compare your result with the closest available benchmark and your own earlier performance. Page optimization is more useful when it addresses a specific gap than when it simply pursues a broad industry average.
Benchmarks can guide your next test, but they can’t explain every difference. A paid social audience may respond differently from visitors arriving through display ads, even on the same page. Review traffic quality, offer relevance, and the path to the call to action before changing page elements. This gives each test a clear purpose and makes results easier to interpret.
Frank Novak
Frank Novak offers resources for people building an online business and applying digital marketing strategies. If you’re using landing page benchmarks to guide broader business decisions, Online Success Coaching can be a relevant next step. It provides a way to develop your understanding and work through how marketing choices fit your goals.
Landing page improvements are one part of building an online business. Use the calculation and comparison methods in this guide to identify questions about your page, then consider how they connect with your wider marketing approach. Choose the next step that fits your needs and priorities.
If you’d like to discuss your online business goals, contact Frank Novak.
Make your next page change a focused experiment
Make your next step a decision, not a redesign. Choose one visitor need your page should meet, then write a simple hypothesis about what could make that need easier to act on. For example, test whether a more specific offer description helps visitors understand its value sooner. Keep the change focused, record what you expect to happen, and use the result to decide what to address next.
A steady approach turns what you’ve learned about how to improve landing page conversion rates into a repeatable practice. Each useful test can sharpen your understanding of your audience and make future marketing decisions more deliberate. You don’t need to change everything at once. Start with the question that matters most to your current goal, then build on what you learn.
Each thoughtful improvement gives you a clearer path forward. Keep learning from your visitors, and build each next step on what came before.
Frequently Asked Questions
What is a good landing page conversion rate?
A rate around 10% or higher is generally considered good, but the right target depends on your industry, offer, and audience. For example, compare an email signup page with similar signup pages, not with a webinar registration page. If your rate is lower, inspect whether visitors understand the benefit and can complete the intended action. A relevant comparison is more useful than treating one benchmark as a universal pass mark.
How long should you test a landing page change?
Run a test until each version has enough relevant traffic and conversions for a meaningful comparison. The right duration depends on normal traffic volume, conversion frequency, and the size of the difference you want to detect. Use an A/B testing tool’s significance estimate, and don’t stop as soon as one version briefly moves ahead. Include regular traffic patterns, such as weekday and weekend visits, when they affect your audience.
What conversion rate should I aim for with paid ad traffic?
Use the paid channel as part of your benchmark: PPC search traffic is around 10.9%, paid social averages 12.0%, and display ads typically convert at 4% to 5%. These figures describe different traffic contexts, so separate campaign results before deciding whether a page is underperforming. For example, compare one paid search campaign with similar search campaigns, then assess whether its visitors complete the intended action.
How can you write a clear landing page headline and call to action?
State the offer’s main benefit in the headline, then make the button describe the visitor’s next step. For a budgeting worksheet, the headline could explain that it helps organize monthly expenses, while the button says “Get the worksheet.” Keep the wording consistent with the ad or search result that brought visitors to the page. This alignment helps people understand what they’ll receive before acting.
How do trust signals, testimonials, and guarantees affect conversion rates?
Relevant testimonials and trust signals help visitors assess an offer’s credibility. A specific customer comment can address a concern about using a guide or course, while a trust badge can clarify a genuine security or payment feature. Include a guarantee only when the business offers one, and state its terms accurately. Don’t add unsupported assurances or present a testimonial as proof of a different claim.

Article by
Frank Novak
Frank Novak is an online marketing professional and coach who focuses on affiliate marketing and business automation. Through his website, frank-novak.com, he shares insights and strategies for leveraging social media platforms like Facebook to generate traffic and commissions.
Affiliate / Sponsored Content Disclaimer
This [website/post] contains affiliate links. If you click through and make a purchase, we may receive a commission at no additional cost to you. We only recommend products or services we believe will add value to our readers.