

Yes. Compare heatmaps across time periods, pages, and devices to see how visitor behavior changes. Using heatmaps to analyze user behavior on affiliate sites is most useful when you compare like with like, such as the same page on mobile and desktop, where layout and interaction patterns can differ.
It’s natural to expect a heatmap to show exactly what’s working, but it captures interactions on parts of a page rather than the whole visitor journey. The key is to read clicks and scroll depth alongside the page’s purpose and conversion data, then use those patterns to identify where an affiliate landing page may need clearer content or a more visible call to action. This article explains what heatmaps reveal, how to compare results meaningfully, and how to turn those observations into practical landing-page improvements without treating a colorful map as proof on its own.
Key Takeaways
- Choose the heatmap type that matches your question: clicks, scrolling, movement, and attention each reveal different parts of visitor behavior.
- Segment results by traffic source or audience to spot patterns that an all-visitor view can hide.
- Account for dynamic page elements and device layouts when interpreting heatmap differences.
- Use click and scroll patterns to find landing-page friction, then assess possible changes alongside conversion data.
- Frank Novak’s Online Success Coaching and affiliate marketing offerings can support your next steps as you build and improve your online business.
Can I filter heatmaps by audience segment, traffic source, or custom data?
Heatmap tools can filter views by traffic source, audience segment, or custom data when that information is captured. They visualize clicks, scrolling, and visitor attention, helping you see how people interact with affiliate pages and where those patterns may affect conversions.
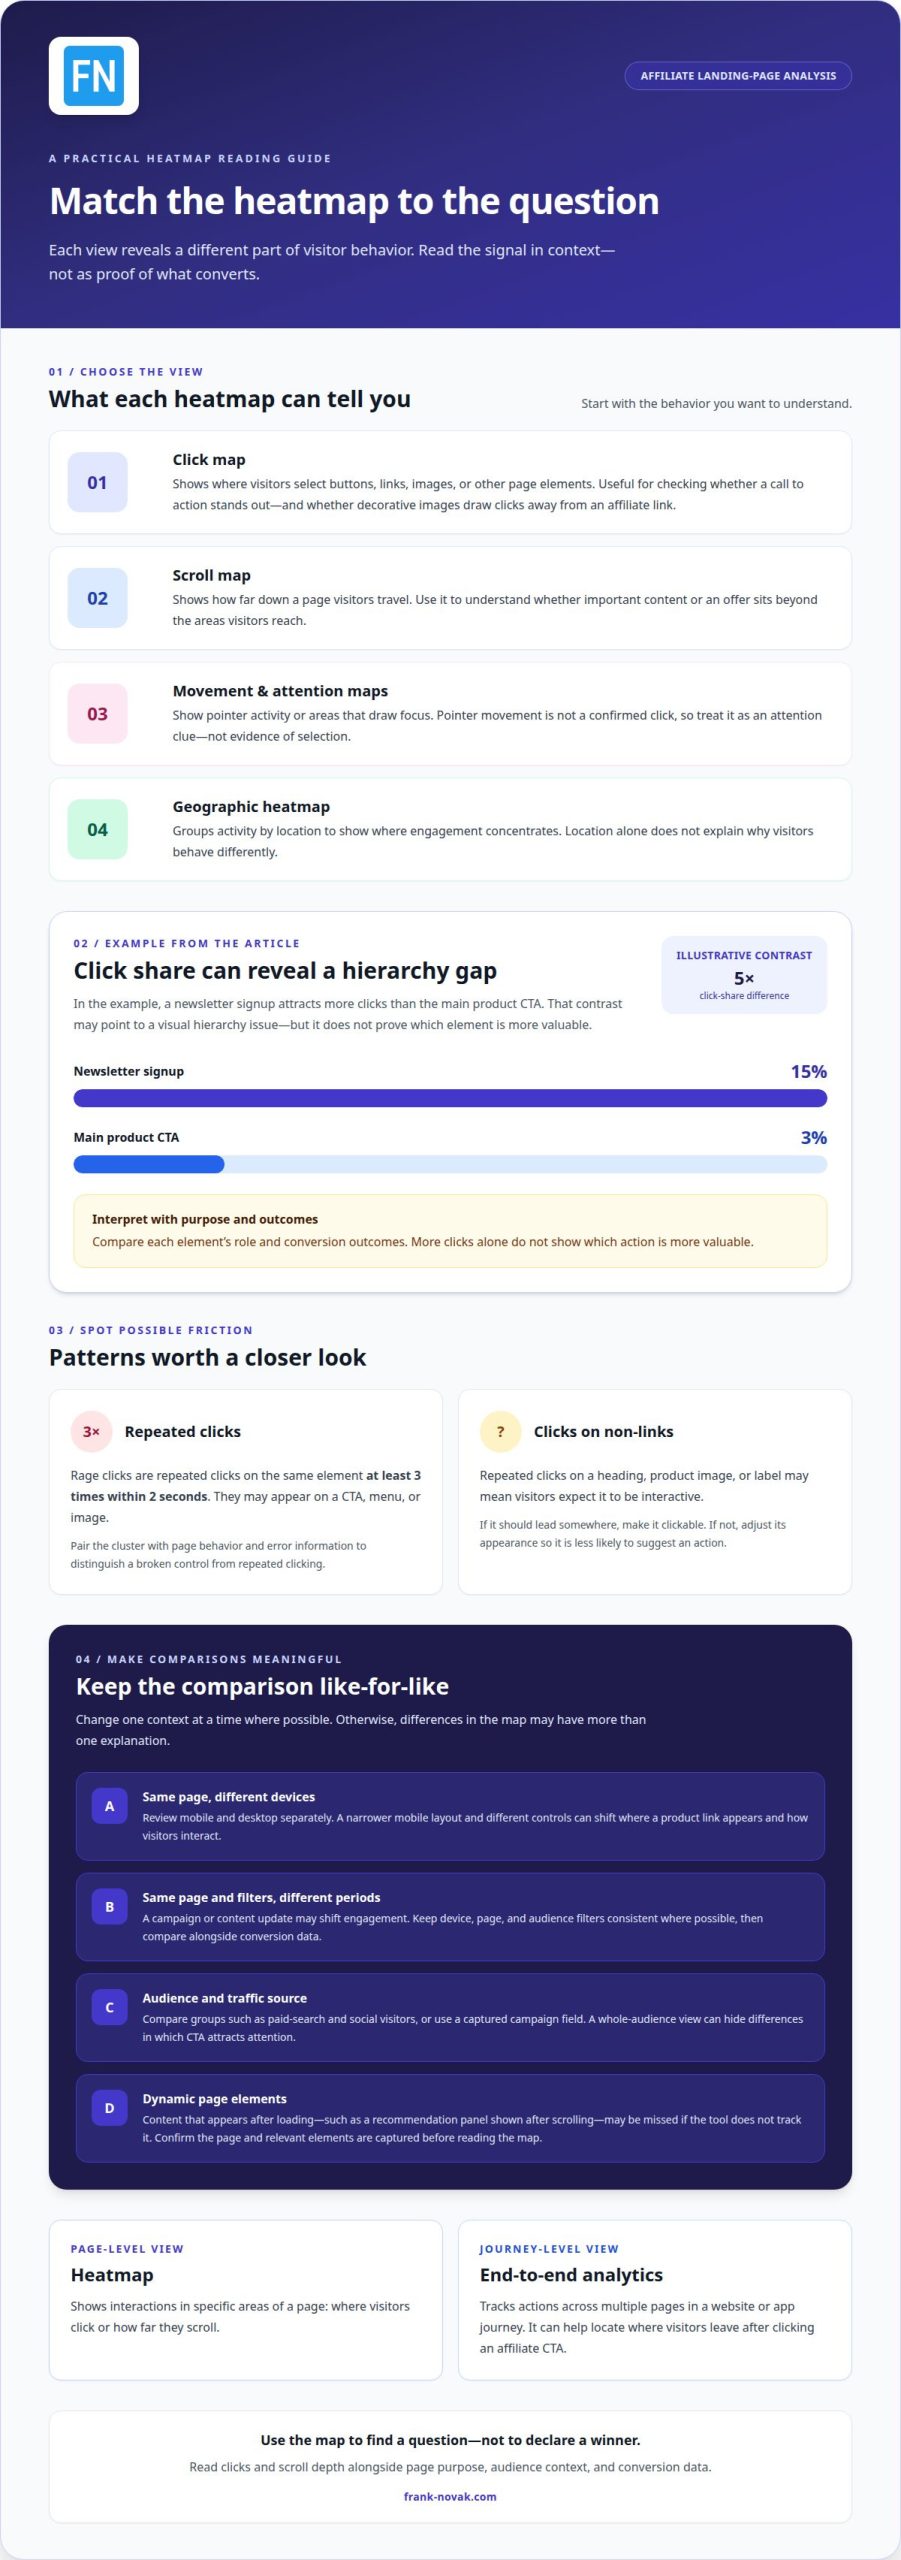
Each heatmap type answers a different question. A click heatmap shows where visitors select buttons, links, or images. A scroll map shows how far down a page they travel. Movement and attention heatmaps show pointer activity or areas that draw focus, but pointer movement is not a confirmed click. Geographic heatmaps group activity by location, helping you compare regional patterns without assuming visitors behave alike.
Use click maps to assess whether a call to action stands out beside other page elements. For example, if a newsletter signup attracts 15% of clicks while the main product CTA gets 3%, the contrast may point to a visual hierarchy problem. It doesn’t prove the newsletter is more valuable; compare the clicks with each element’s purpose and conversion outcomes. Also check whether decorative images draw clicks away from the affiliate link.
Click maps can reveal confusing interface cues. If visitors repeatedly click a heading, product image, or label that does not open anything, they may expect it to be interactive. Make the element clickable if it should lead somewhere, or adjust its appearance if it should not. Clusters around a small control can also highlight an area that may be difficult to use.
Look for friction signals, including repeated clicks that produce no visible response. Rage clicks are repeated clicks on the same element at least 3 times within 2 seconds. On an affiliate landing page, that pattern could appear on a CTA, menu, or image. Pair the click cluster with page behavior and error information to distinguish a broken control from a visitor who simply clicks more than once.
Segmentation makes these clues more useful. Compare paid-search visitors with social visitors, or group traffic by a custom campaign field, to see whether the same CTA attracts attention from each audience. A geographic heatmap can show where engagement concentrates, but interpret each filter alongside the page’s goal, scroll depth, and conversion data.
Can I compare heatmaps for different time periods, pages, or device types?
Yes. Compare heatmaps across pages, periods, audience segments, and devices to see where engagement patterns change. Keep the question consistent, such as comparing the same affiliate landing page before and after a layout change. Heatmaps show where people click or scroll; conversion data helps indicate whether those interactions support the page’s goal. A colorful map alone cannot explain why behavior changed.
Compare mobile and desktop in separate views. Mobile visitors encounter a narrower layout and different controls, so combining devices can hide important differences. A product link near the top on desktop, for example, may appear farther down on mobile. Compare the same page over similar time periods, then look for click or scroll patterns that point to a mobile improvement.
Comparing time periods can show whether engagement shifts after a campaign or content update. Keep the page, device, and audience filters consistent where possible. If two banners lead to the same destination, their combined clicks may conceal which offer drew attention. Compare them separately when tracking allows, and read changes alongside conversion data rather than treating more clicks as proof of better results.
Heatmaps and end-to-end analytics answer different questions. A heatmap focuses on interactions in specific areas of a page; end-to-end analytics tracks actions across multiple pages throughout a website or app journey. If visitors click an affiliate CTA but do not complete the next step, the heatmap shows the interaction, while journey data can help locate where they leave. Use both for a fuller picture.
Location comparisons can reveal whether engagement differs across geographic groups. A geographic heatmap shows where activity concentrates, while click and scroll maps show what visitors do on particular pages. Location alone does not explain behavior. Compare regions in the same page and device context, and consider whether traffic sources or audience mix might explain the pattern.
Tool comparisons also require care. Different heatmap tools may produce reports that aren’t directly comparable, so differences can reflect how tools collect or display data. Enterprise-level heatmap solutions can cost thousands of dollars per month. Compare the features needed for your analysis, such as segmentation and device views, against the reporting your team will use. For broader affiliate marketing guidance, consider how heatmap findings fit into your overall business decisions.
Heatmap tool features such as segmentation and dynamic element tracking
A heatmap tool turns visitor interactions into visual patterns across a page. Segmentation separates those patterns by audience or traffic source, while dynamic element tracking can capture interactions with content that changes after loading. For example, an affiliate page might display a recommendation panel only after a visitor scrolls. If the tool misses that panel, the map will not show how visitors engage with it.
Start by adding the heatmap tool’s script to the pages you want to study. Then confirm that the relevant pages and elements appear in its reports. An affiliate landing page might include a product comparison, a disclosure, and a button leading to an offer. Check that each section loads and that the tool captures its interactions before interpreting patterns. Review the map after significant layout changes, since updates can shift element positions.
Device tracking matters because mobile, tablet, and desktop layouts present different interaction areas. Create separate heatmaps for each device type rather than combining activity. A button placed beside product details on desktop might appear below them on mobile, while a tablet may use a different column arrangement. Those differences can change which elements visitors see first and where clicks collect.
Heatmaps and eye-tracking don’t measure the same thing. Movement heatmaps record pointer movement, while eye-tracking measures where a person looks. Movement heatmaps have a reported 64% correlation with actual eye movement, but that relationship doesn’t make pointer activity a direct record of gaze. Treat movement as a clue about page attention, then compare it with clicks, scroll depth, and the purpose of each section.
Cookie settings and visitor choices can limit the activity a heatmap tool records. Heatmaps work best when a site has substantial traffic and visitors agree to share their cookies. A site with hundreds of users a day may have a more useful pool of activity for interpreting patterns. If cookie sharing is limited, some visits may not appear in the heatmap, so the visualization represents recorded activity rather than every page visit.
Before relying on a pattern, check whether the tool captures the page as visitors actually see it. An expanding menu, sticky CTA, or delayed recommendation may appear only after an interaction. Compare the tool’s view with those elements on mobile, tablet, and desktop. If a section is missing or misplaced, correct the tracking setup before using the map to guide page changes.
Segmenting heatmap data by traffic source and audience
A heatmap becomes more useful when its view answers a specific comparison. Separate visitors by traffic source, such as paid search, email, or social referrals, if the tracking data records that source. Then compare how each group interacts with the same affiliate page. A combined map may conceal that one audience scrolls to product details while another leaves near the introduction.
Audience filters can distinguish new and returning visitors or groups defined by campaign data. Returning visitors may already recognize an offer, while first-time visitors may need more explanation before clicking. Compare each group’s clicks and scroll depth with the page’s purpose. You can also filter by device or view mobile and desktop separately, since a compact screen changes how content and calls to action appear.
Sample size affects how confidently you can interpret a pattern. A useful working sample is at least 2,000 visits, and data can be collected over a couple of weeks while waiting for results. If a page receives fewer visits, extend collection rather than treating a small cluster as a stable audience preference. Keep the page and filters consistent during that period.
A four-step review keeps the comparison focused:
- Choose the question. For example, ask whether email visitors reach the affiliate offer more often than social visitors.
- Set the filter. Select the traffic source, visitor type, or device dimension that matches the question.
- Read the map. Compare clicks and scroll patterns, then note where the groups diverge.
- Check the outcome. Compare the pattern with conversion data before proposing a page change.
Recordings can add context when a heatmap shows an unexpected cluster. If visitors from one campaign repeatedly pause near a comparison table, review recordings from that segment to see whether the information flow seems unclear. Use recordings to explore possible explanations, not to assume one visitor represents the entire group. A focused test can help determine whether the pattern matters.
For deeper analysis, export the available heatmap data or report. Keep the page, date range, filter, and device labels with each export so future comparisons remain interpretable. A simple table can put traffic sources in rows and measures such as clicks, scroll depth, or conversions in columns. Label differences between filters rather than treating unlike exports as equivalent. Preserving this context makes follow-up analysis more useful.
Using heatmap insights to improve affiliate landing pages
Start with one high-traffic affiliate page and a clear conversion goal. A heatmap can show whether visitors reach product details, interact with the offer, or leave before seeing the main call to action. Use what you observe to form a specific hypothesis, such as moving key information higher if too few visitors reach it.
Scroll patterns help locate the point where attention fades. In one example, 60% of users scroll halfway down a page, while 75% reach the location marked by a yellow line. Read those points in the context of the page, not as universal benchmarks. If only 10% of visitors reach a CTA, consider whether its position, supporting content, or the page’s length needs review.
A fold line marks where 50% of users stop scrolling. That point can guide content placement, but a 50% drop-off doesn’t automatically mean the page is failing. Visitors may already have enough information, or they may need more context. Compare the scroll pattern with the page’s conversion rate to decide whether the section above the fold is doing its job.
Movement and click patterns can help distinguish visibility from intent. A CTA may attract concentrated clicks even as the conversion rate falls. Look beyond button placement: examine the surrounding content, the destination, and any mismatch between the promise and the next step. If two banners lead to the same page, their combined activity may also obscure which message drew visitors.
A/B tests can evaluate changes suggested by heatmaps before you roll them out across a site. Test one focused change, such as moving a CTA or revising the section that introduces an offer, then compare engagement and conversion outcomes between versions. Keep the page goal and audience consistent so the results help assess the change rather than unrelated differences.
Use a session heatmap as a starting point, not a complete explanation of the visitor journey. If visitors stop scrolling before a comparison table, for example, test whether moving a concise summary higher helps them reach the affiliate offer. Review clicks and conversions together. If engagement rises but conversions do not, the change may have improved visibility without giving visitors what they need to decide.
The takeaway is to connect each visual pattern to a testable page change. Dreams recorded a 150% increase in mobile click rate and an 18% increase in revenue over just 5 days after moving a high-performing section to a more prominent position. Results like these show why teams can use heatmap insights to identify a change, then measure its effect.
Frank Novak
Frank Novak helps readers build and develop affiliate businesses through practical online marketing guidance. If heatmap findings raise questions about your landing page, connect those observations to broader goals, such as improving how your affiliate funnel presents an offer. Online Success Coaching offers guidance for shaping your online business, while ClickBank Super Funnel and Clickbank Profit Club provide additional affiliate-focused resources. Never Succeed Online is another resource for exploring online business development. These offerings are not heatmap analysis tools; they fit when you are ready to apply insights to a broader affiliate marketing plan.
If you’d like to discuss your next steps, contact Frank Novak.
Make Your Next Landing-Page Decision More Deliberate
Turn one observation into a focused improvement. As you use heatmaps to analyze user behavior on affiliate sites, record the question behind each change and the outcome you want to influence. This gives each review a purpose and helps distinguish a useful insight from an interesting visual pattern.
You do not need to redesign an entire page at once. Choose a section that supports a clear business goal, make a considered adjustment, and use the resulting behavior to decide what to explore next. This steady process can help you make landing-page decisions with greater clarity and connect user experience to your broader affiliate marketing plans.
If you’re ready to build on your affiliate marketing approach, connect with Frank Novak.
Learn from each change, and let what you observe guide your next decision.
Frequently Asked Questions
Conclusion: Should you use a heat map for a website?
Use a heatmap when you have a specific page question that interaction data can help answer. If visitors reach a product comparison but rarely click its offer links, for example, a heatmap can show where activity gathers. Pair that observation with conversion data before changing the page. For a low-traffic page or a question about actions across several pages, other analytics may provide more useful context.
Do heatmaps work with pages behind a login, checkout flows, dynamic content, longer pages, or SPAs?
Heatmaps can work in these settings when the tracking tool can access and record the page states involved. Login restrictions, checkout steps, content that loads after interaction, and single-page application route changes can affect what gets captured. For a long page, confirm that the map represents its full length. For an affiliate checkout handoff, compare activity recorded on your site with the next step you can measure.
Do heatmaps automatically generate for mobile or tablet visitors as well?
Not always. A heatmap tool must collect activity from those visitors, and its reports may separate devices or combine them. Check whether mobile and tablet data appear in distinct views before drawing conclusions. A mobile visitor may encounter a sticky button that does not appear on desktop. If device views are available, compare the same page and similar audience filters to interpret layout differences.
So What Are Heatmaps, Anyway?
Heatmaps are visual reports that use color intensity to represent activity or values. On a website, the colors can make busy areas and quieter areas easier to spot. Imagine a landing page where the brightest area sits around an image, while the affiliate link receives little interaction. That picture can prompt a closer look at placement and design, but it doesn’t explain visitors’ intentions by itself.
What is a website heatmap?
A website heatmap is a visual layer showing recorded visitor activity on a page. Depending on the report, it may represent clicks, scrolling, or pointer movement. A scroll view, for instance, can help reveal whether visitors reach a disclosure near the bottom of an affiliate page. Heatmaps show page-level patterns; they do not replace analytics that follow actions between pages or record business outcomes.
Which heatmap types are most useful for affiliate sites: click, scroll, move, and attention?
Choose the heatmap type according to your question. Click maps help assess activity on links and buttons; scroll maps show how far visitors travel. Movement maps record pointer activity, while attention maps estimate which areas draw focus. For an affiliate review page, combine scroll depth with clicks around the offer link. Treat pointer movement as a clue, not direct eye-tracking evidence, and check conversion outcomes separately.
How can heatmaps identify high-performing affiliate links and calls to action?
Compare activity around each tracked link or CTA, then connect those interactions to conversion outcomes. A bright cluster may show that visitors select a link often, but click density alone does not establish that it performs well. A prominent link could attract clicks while visitors leave its destination quickly. Use consistent page and audience filters, and evaluate what happens after each click.
What are the best heatmap tools for affiliate marketers, and how do their features compare?
Compare tools based on whether they offer audience and traffic-source segmentation, separate device views, and dynamic element tracking. Reports from different tools may not be directly comparable.

Article by
Frank Novak
Frank Novak is an online marketing professional and coach who focuses on affiliate marketing and business automation. Through his website, frank-novak.com, he shares insights and strategies for leveraging social media platforms like Facebook to generate traffic and commissions.
Affiliate / Sponsored Content Disclaimer
This [website/post] contains affiliate links. If you click through and make a purchase, we may receive a commission at no additional cost to you. We only recommend products or services we believe will add value to our readers.